Commercial Building Age and HVAC Statistics for Ohio's Region
We analyzed the U.S. Energy Information Administration's latest survey of commercial buildings to answer one question for facility managers: how old are the buildings in Ohio's region, and what heats, cools and maintains them?
The survey covers 1,110 thousand commercial buildings in the East North Central states (Ohio, Indiana, Illinois, Michigan and Wisconsin), 18.8% of the 5,918 thousand in the United States, and compares them with the national picture. Our Cleveland, Columbus and Dayton crews work in these buildings every week.
Here is what we found.
Key Findings at a Glance
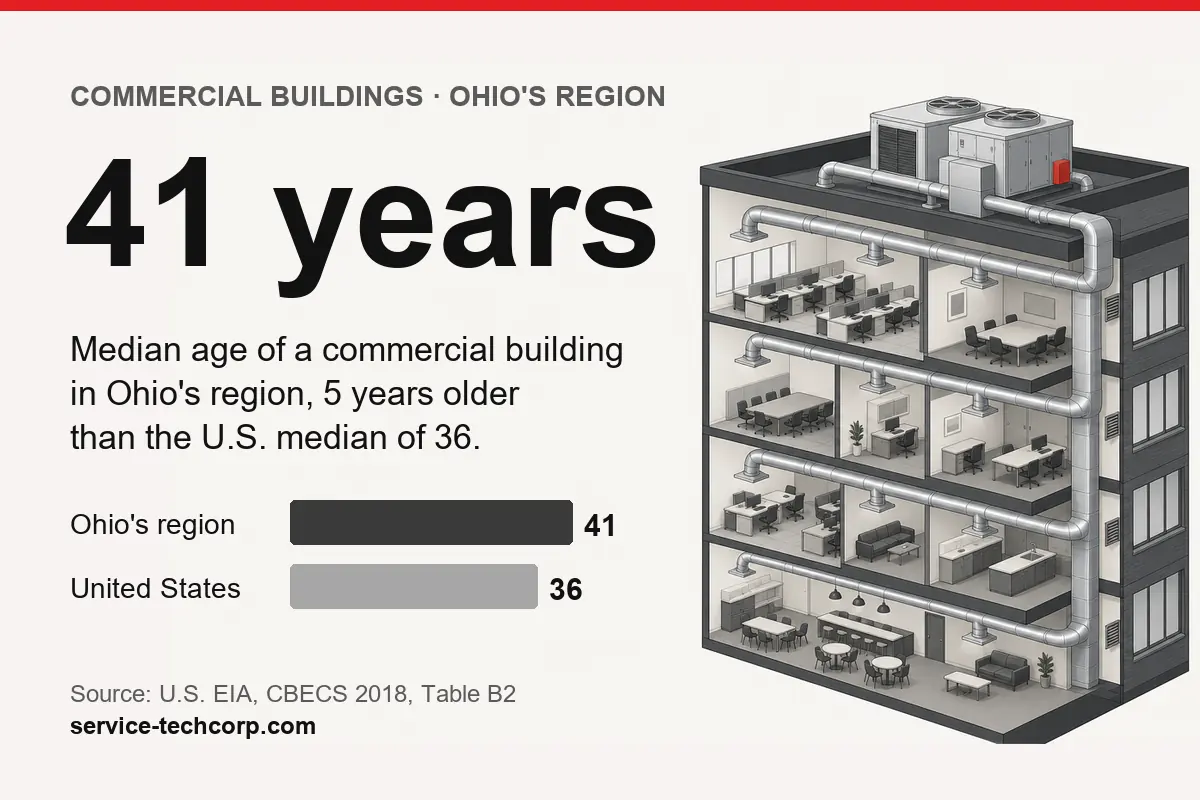
- The median commercial building in Ohio's region is 41 years old, 5 years older than the U.S. median of 36.
- 42.7% of the region's commercial buildings are heated with furnaces, against 27.4% nationally.
- 52.8% were built before 1980, compared with 46.3% of U.S. commercial buildings.
- 15.5% were built before 1946 (U.S.: 12.0%).
- 32.4% are cooled with residential-type central air conditioners (U.S.: 22.1%).
- Only 30.5% have replaced their main heating equipment since 2000 (U.S.: 32.7%).
- About half, 51.6%, report regular HVAC maintenance, compared with 60.1% of U.S. commercial buildings.
The Median Commercial Building in Ohio's Region Is 41 Years Old
The median commercial building in Ohio's region is 41 years old, according to the U.S. Energy Information Administration's Commercial Buildings Energy Consumption Survey (CBECS), which reports Ohio as part of the East North Central census division. Nationally the median is 36, so the region's buildings are 5 years older at the midpoint.
East North Central: 41; United States: 36
Source: U.S. EIA, Commercial Buildings Energy Consumption Survey 2018, Table B2
The age of a building is not the age of its HVAC system, since equipment is replaced. It does show how long the building itself has been in service.
More Than Half Were Built Before 1980
More than half of the region's commercial buildings, 52.8%, were built before 1980, and 15.5% before 1946. For the United States the shares are 46.3% and 12.0%.
ENC, before 1980: 52.8%; U.S., before 1980: 46.3%; ENC, before 1946: 15.5%; U.S., before 1946: 12.0%
Source: U.S. EIA, Commercial Buildings Energy Consumption Survey 2018, Table B4
Furnaces Heat 42.7% of the Region's Commercial Buildings
Furnaces heat 42.7% of commercial buildings in the region, against 27.4% nationally, a gap of 15.3 percentage points. CBECS asks which heating equipment each building uses, and more than one type can apply.
East North Central: 42.7%; United States: 27.4%
Source: U.S. EIA, Commercial Buildings Energy Consumption Survey 2018, Table B4
A building can use more than one type of heating, so these shares do not add up to 100%. Ducted systems are what our Aeroseal duct sealing service tests and seals.
One in Three Uses Residential-Type Central Air
Residential-type central air conditioners cool 32.4% of the region's commercial buildings, compared with 22.1% of U.S. commercial buildings.
East North Central: 32.4%; United States: 22.1%
Source: U.S. EIA, Commercial Buildings Energy Consumption Survey 2018, Table B4
Fewer Than a Third Have Replaced Their Main Heating Equipment Since 2000
Main heating equipment has been replaced since 2000 in 30.5% of the region's commercial buildings (U.S.: 32.7%).
East North Central: 30.5%; United States: 32.7%
Source: U.S. EIA, Commercial Buildings Energy Consumption Survey 2018, Table B4
The survey counts buildings of every age here, including buildings built after 2000.
About Half Report Regular HVAC Maintenance
Regular HVAC maintenance is reported by 51.6% of the region's commercial buildings. Nationally the figure is 60.1%.
East North Central: 51.6%; United States: 60.1%
Source: U.S. EIA, Commercial Buildings Energy Consumption Survey 2018, Table B4
The regional estimate is based on a survey sample and may differ from the true share by several points (see Methods below), so read the comparison with the national figure as approximate. If you manage one of these buildings, our commercial air duct cleaning starts with an inspection, and the cost guide explains how a quote is built.
How We Built This Report
- Source. U.S. Energy Information Administration, 2018 Commercial Buildings Energy Consumption Survey (CBECS), building characteristics Tables B2 and B4 (released September 2021, revised December 2022). The 2018 survey is the most recent edition EIA has released. Retrieved Nov 15, 2026.
- Geography. CBECS reports by census division, not by state. Ohio's division is East North Central (Ohio, Indiana, Illinois, Michigan and Wisconsin), so these figures are not figures for Ohio alone.
- Uncertainty. CBECS publishes relative standard errors. For the division, the building count has a relative standard error of 13.1% and the regular-maintenance count 13.6%, so regional shares are approximate.
- Counting. Buildings of more than 1,000 square feet. Equipment categories can overlap ("more than one may apply").
- Refresh. When EIA publishes a newer CBECS, we will update this page at the same address.
You're welcome to use these charts on your own site with a link back to this page.
Frequently Asked Questions
How Old Are Commercial Buildings in Ohio?
Ohio's commercial buildings fall within the East North Central division in federal survey data, where the median commercial building is 41 years old, against 36 nationally.
What Share of Commercial Buildings Get Regular HVAC Maintenance?
Regular HVAC maintenance is reported by 60.1% of U.S. commercial buildings; in Ohio's region the figure is 51.6%.
How Are Commercial Buildings in the Midwest Heated?
Furnaces heat 42.7% of commercial buildings in the East North Central division, compared with 27.4% nationally; many buildings use more than one type.