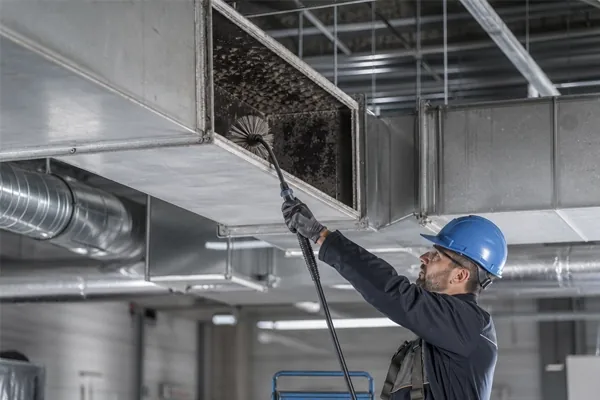
Not the residential listicle — seven signs specific to plants and heavy commercial buildings, each paired with a check your maintenance team can measure this week.
Direct Answer: The reliable signs an industrial facility's ducts need cleaning are measurable, not cosmetic: dust discharge at diffusers, accelerating filter loading, rising static pressure and energy draw, visible accumulation at inspection points (critical where dust is combustible), contamination complaints from production or occupants, post-construction debris, and moisture or microbial odor in the system. Any confirmed sign calls for a documented assessment — the entry point to Service-Tech Corporation's industrial air duct cleaning service.
Why Industrial Signs Differ From the Residential Listicle
The articles ranking for this query recycle the same homeowner symptoms — dusty furniture, allergies, "musty smells." A plant or heavy commercial building gives earlier and better signals, because it has instrumentation and trained eyes a house does not: filter change logs, static-pressure gauges, PM checklists, QC complaints. The seven signs below use them. Each comes with a verification step, because in an industrial budget conversation "the ducts look dirty" loses to "here is the measurement."
Sign 1: Visible Dust Discharge at Diffusers and Registers
Dust plumes when a system cycles on, streaking on ceiling tiles around diffusers, or debris accumulating on surfaces directly below supply outlets means the ductwork downstream of your filters is loaded and shedding — the filtration argument is already lost at that point. Measure it: wipe-test a diffuser face and photograph it, then re-check the same diffuser two weeks after cleaning the grille. Rapid re-soiling is duct-borne, not housekeeping.
Sign 2: Filters Loading Faster Than Their History
Filters are your system's dust flow meter. If pressure-drop change points arrive weeks earlier than the same season last year — with no process change to explain it — more particulate is circulating, and what the filters catch is a fraction of what the duct interior is accumulating. Measure it: trend filter change dates or pressure-drop readings from your CMMS by quarter. The slope, not any single reading, is the signal.
Sign 3: Static Pressure Creep and the Energy Bill Behind It
Accumulation narrows effective duct cross-section and roughens surfaces; coils foul; fans work harder to move less air. The symptom chain is rising static pressure at constant fan speed, VFDs ramping to hold setpoint, weak delivery at the far ends of runs, and an HVAC energy line drifting upward without a rate change. Fouled systems pay this penalty continuously — it is the quietest cost in the building. Measure it: log static pressure across the air handler seasonally with clean filters installed. A rising clean-filter baseline points at ducts and coils. Comfort complaints clustered at long-run zones corroborate it.
Sign 4: Visible Accumulation at Inspection Points — the Combustible-Dust Red Line
Open an access panel or pull a register and look: measurable dust depth, oil-mist film, or debris ridges at duct joints is direct evidence. In plants generating combustible dust — wood, plastics, food powders, metal fines — this sign changes category entirely: NFPA's combustible-dust standards treat hidden accumulation as a housekeeping obligation, with action commonly keyed to accumulation thresholds on the order of a thirty-second of an inch over meaningful surface areas. Duct interiors are exactly the "hidden surfaces" a dust hazard analysis flags. Measure it: photograph interior surfaces at 3-4 fixed reference points annually. In dust-generating plants, make duct interiors an explicit line in your housekeeping inspections — an insurer or OSHA visit will treat them as one.
Sign 5: Product Contamination or Occupant Complaints Traced to Air
In food, beverage, coating, and electronics operations, duct-borne particulate shows up as QC findings: specks in product, paint defects, failed swabs near air outlets, audit observations about overhead hygiene. In occupied buildings it shows up as clustered IAQ complaints in specific zones. Both are downstream evidence of an upstream reservoir. Measure it: map complaint or defect locations against the zones each air handler serves. A pattern that follows one system's distribution is a duct signal, not a coincidence.
Sign 6: Recent Construction or Renovation Without Duct Protection
Drywall dust, concrete fines, and insulation debris enter open or unprotected ductwork during construction and shed for years afterward. If your facility renovated and nobody capped returns or cleaned the affected systems before turnover, assume the debris is in the duct — this is one of the most common assessment findings in otherwise clean buildings. Measure it: open one return-side access point in the renovated zone. Construction debris is unmistakable: it is grit and fragments, not dust film.
Sign 7: Moisture History or Microbial Odor on System Start
A musty odor when a system starts, past water events (roof leaks, coil condensate overflows, flooding), or visible growth on internal insulation means the duct problem is biological, not just particulate. Cooling-season humidity turns accumulated dust into a growth substrate; internal duct liner that has been wet is a chronic reservoir. Measure it: inspect downstream of cooling coils and at any historically wet section; document with photos. Microbial findings change the remediation scope — this is an assessment-now sign, not a next-budget-cycle sign.
What Does Ignoring Each Sign Cost?
| Sign Ignored | The Risk That Matures |
|---|---|
| Diffuser discharge, filter creep | Occupant complaints escalate; filtration spend rises while the cause compounds |
| Static pressure creep | Continuous energy penalty; premature fan and motor wear; capacity loss at build-out |
| Combustible accumulation | Housekeeping citations, insurer findings, and a live deflagration fuel load |
| Product contamination | QC losses, audit findings, customer complaints — and recall exposure in food operations |
| Construction debris | Years of shedding into new space; disputes over "new building, dirty air" |
| Moisture/microbial | IAQ episodes, remediation scope growth, liner replacement instead of cleaning |
How Fast Should You Act, and Who Confirms It?
Triage: combustible-dust accumulation and microbial findings call for assessment now; product-contamination patterns this month; performance and filtration trends at the next planning cycle. Confirmation should be a documented assessment — fixed-point photos or borescope imaging, conditions classified, scope defined — performed to the NADCA ACR model by a qualified assessor, so the same visit that confirms the sign produces the evidence and the scope. Service-Tech Corporation has run assessment-driven duct programs as a NADCA member since 1990, across 100,000+ facilities serviced since 1960.
What Do Confirmation and Cleaning Cost?
Estimates are free and follow a site walk. Commercial air duct cleaning starts from $1,375; industrial projects are quoted from the assessment findings — contamination class, access, containment, and scheduling set the number. Lighter-duty buildings can scope against our commercial air duct cleaning service.
TL;DR — The Seven Signs on One Screen
Watch the measurements, not the folklore: (1) dust discharge at diffusers, (2) filters loading faster than their own history, (3) clean-filter static pressure creeping up with the energy bill, (4) visible accumulation at inspection points — a red-line item where dust is combustible, (5) product or occupant complaints mapping to one system's zones, (6) unprotected construction, (7) moisture history or microbial odor. Each has a check your team can run this week; two or more confirmed means book a documented assessment. Cleveland facilities can start with a free site walk — more diagnostic guides are on our blog.
Frequently Asked Questions
How much dust in a duct is too much?
For ordinary dust, the trigger is functional: visible accumulation shedding into occupied space, fouling coils, or raising static pressure. For combustible dusts the bar is far lower — NFPA housekeeping criteria key action to thin accumulation layers over meaningful areas, and duct interiors count as the hidden surfaces a dust hazard analysis must address. When in doubt, photograph and assess.
Can I verify these signs without opening the ductwork?
Mostly, yes: filter-loading trends, static-pressure logs, diffuser wipe tests, and complaint mapping all use data you already collect. But confirmation and scoping require looking inside — access panels or borescope imaging at representative points. A professional assessment documents interior conditions with photos so the decision is made on evidence.
Do new buildings really need duct cleaning?
Frequently, yes — construction debris is one of the most common assessment findings in new and renovated buildings when ductwork was not protected and cleaned before turnover. Grit and fragments left in returns and trunk lines shed into occupied space for years. Verify with one access-point inspection in the affected zone.
Turning a Symptom Into a Measurement
Every sign on this list has a corresponding reading. Dust from the registers: swab and weigh against the NADCA figure of 0.75 mg per 100 cm². Reduced airflow: read the pressure drop across the coil face and check whether fins need straightening. Fibre in the airstream: press the liner and see whether it delaminates under light pressure, which decides encapsulate versus replace. Anything you cannot see: borescope it. Once measured, the work follows — brushes agitate bare metal, whips handle liner, the system stays under continuous negative pressure while contamination is extracted, the plenum and fan housing are opened, and everything is reinstated and pressurized.
Each Sign, and the Measurement That Confirms It
| The sign | The reading that confirms it | The threshold |
|---|---|---|
| Dust from supply registers | Swab and weigh a surface sample | 0.75 mg per 100 cm² on the NADCA Vacuum Test |
| Reduced airflow at the diffusers | Pressure drop across the coil face | Measured against the design figure |
| Fibre or particulate in the airstream | Press the liner for release | Any shedding under light pressure |
| Rising energy cost with no load change | Restriction attributable to fouling | DOE attributes 25–40% of heating and cooling energy to it |
| Filters loading faster than before | Filter grade and change interval | MERV 8 or better; humidity held 30–60% |
| Nothing visible, no records | Borescope the runs beyond reach | Visual, against a SMACNA cleanliness level |
The Reading That Settles All of Them
If you take only one measurement, take the gravimetric one: a surface sample swabbed and weighed against 0.75 mg per 100 cm² of duct area. It converts every sign on this list from an argument into a number, and it is the figure to write into a scope of work so the contractor's result can be checked rather than trusted.
Two Figures Worth Writing Down
The acceptance threshold is 0.75 mg of residue per 100 cm² of duct surface on the NADCA Vacuum Test, and NADCA's interval guidance is annual on air handling units against every 1–2 years on the ductwork they feed. Between them those two numbers convert this whole list from a set of impressions into a maintenance programme you can put a date and a pass condition against.